A rainbow is caused by the interaction of a beam of light with a drop of liquid. In the laboratory, rainbows formed by a laser beam illuminating a drop of liquid can be studied. By filming the rainbow, we can then study and extract physical information about the drop from this signal. The size of the drop can be estimated, as can its concentration when it contains nanoparticles.
How do you study a drop in the laboratory?
It is therefore possible to obtain a curve tracking the evaporation of a drop of fluid containing nanoparticles (in other words, a colloidal suspension). To carry out this experiment, a laser can be used to illuminate the droplet:
- a drop placed on a hydrophobic support
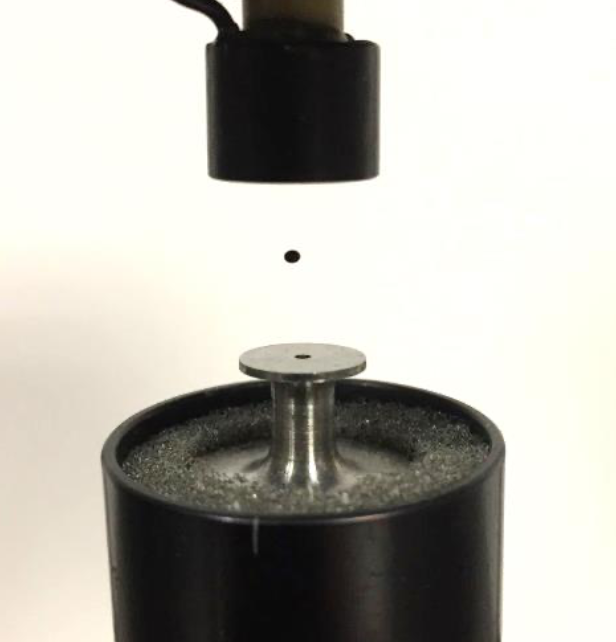
- an acoustically levitating drop
The latter method is used for all the results presented in this article (see image below). The drop levitates in a spatially and temporally stable acoustic pressure node (between a transducer and a reflector). As a first approximation, we assume that the ultrasonic levitator (F=100kHz) has no influence on the drying of the trapped drop. With this method, it's easy to illuminate the single drop with a suitable laser. It's worth mentioning here that the laser does not heat the drop or influence its evaporation.
The rainbow phenomenon on a spherical, homogeneous drop
Within the framework of classical geometrical opticsthe rainbow phenomenon is linked to the existence of a limiting angle of deviation for light rays of order p=2. In other words, light rays that have undergone a single internal reflection inside a spherical, transparent drop.
The following figure (left) shows that the scattering angle θp=2 of these rays first increases with the impact parameter (distance from the optical axis) of the incident rays, before passing through a maximum θac called the "angle of the first rainbow", and then decreasing.
For θ2>θac no p=2 rays are scattered, so this area of the scattering diagram corresponds to the start of the Alexander dark band.
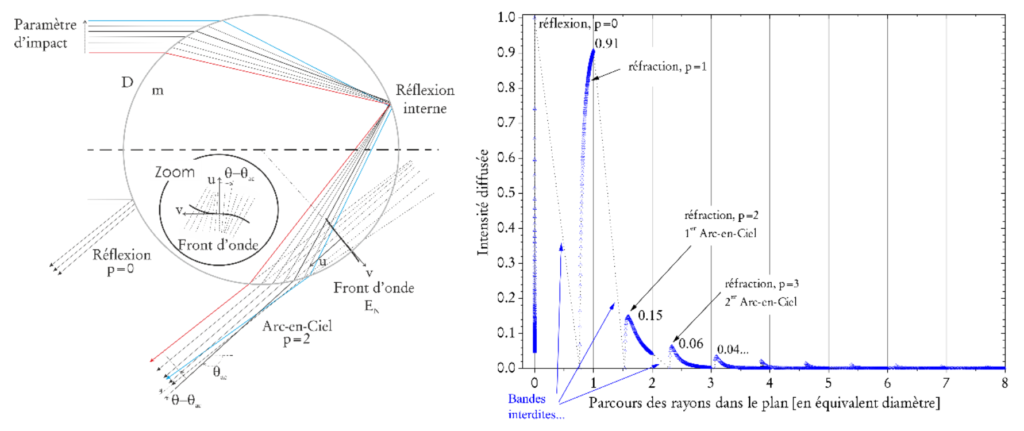
For θ2≤θac, two types of p=2 rays superimpose and interfere at infinity to produce the (so-called "first-order") rainbow. There are in fact an infinite number of rainbows: first-order rainbows produced by p=2 rays, second-order rainbows produced by p=3 rays, third-order rainbows produced by p=4 rays, etc. However, due to multiple internal reflections, the decay of the energy of p=2 rays is very rapid, as illustrated by the previous figure (left). This is why, in nature, while the first rainbow (p=2) is observed quite frequently, it is more difficult to observe the second (p=3) and extremely difficult to observe higher-order rainbows.
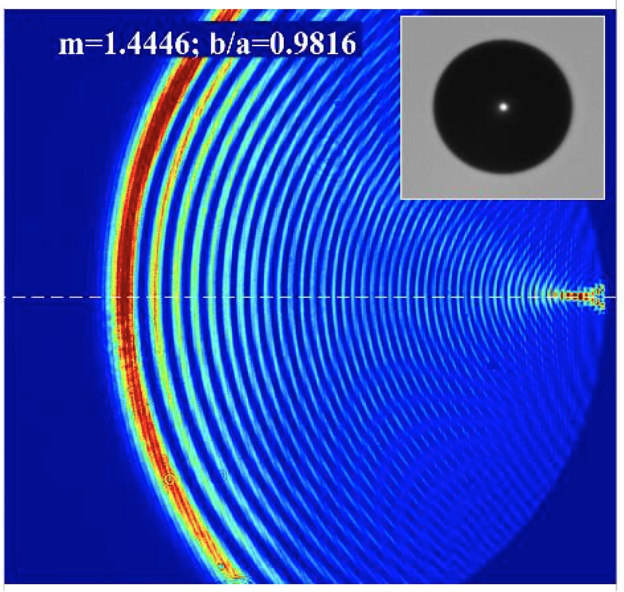
There are various theories for calculating scattering patterns across liquid droplets. The figure below shows two scattering diagrams using thegeometrical optics model and Debye theory. We won't go into detail about these theories in this article.

Principle of the rainbow diffractometry technique
Rainbow diffractometry seeks to reproduce the rainbow phenomenon in the laboratory, in order to characterize the diameter and refractive index of the particles (in this case, in the sense of a drop) that generate it. It can be described as a "rainbow technique", "rainbow thermometry" or "rainbow refractometry". In the literature, however, this optical technique is used in two different ways (see following figure). In the first case, temporal statistics are obtained by counting a large number of events (i.e. individual drops). In the second case, spatial statistics are obtained for all drops present at a given moment in the system's measurement volume.
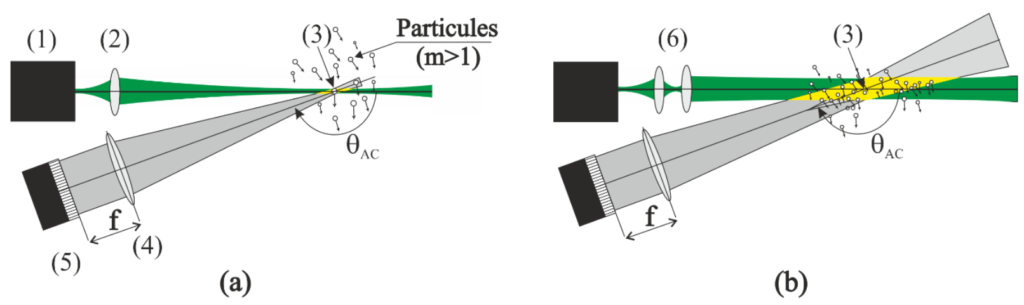
The detection optics essentially comprise a collection optic and a CCD camera (linear or 2D). The sensor is placed in the Fourier plane of the lens (distance f). However, to better define the dimensions of the measurement volume and to be able to analyze slightly denser (but still fairly dilute) flows, it is often preferable to add a spatial filter to this sensing optic. As already mentioned, the first rainbow appears as a superposition of two fringe arrays. Referred to as a ripple structure, the second network is frequently considered a parasite of the rainbow, as it makes it difficult to measure the angular position of low-frequency bangs. Others see it as an asset, as this second frequency can be used to test the sphericity of the drop. Nevertheless, in general, the diameter and index of the drop are most often deduced from the measurement of the angular position of the first and second bangs. The index can also be obtained directly from measuring the angular position of the first inflection point.
In view of the ripple and the fact that experimental signals are always noisy, the latter solution seems very difficult to implement. The single-drop rainbow technique is also very sensitive to trajectory effects and drop non-sphericity, as well as to the presence of index gradients within the drops.
Rainbow diffractometry: spherical and inhomogeneous drops
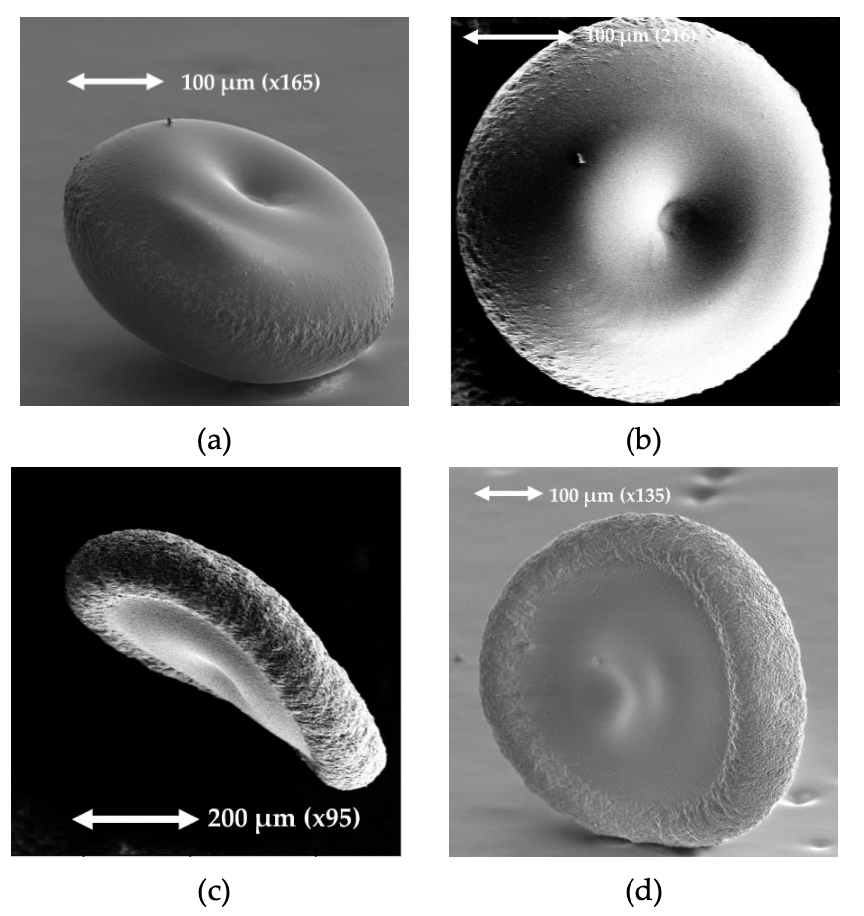
Since the refractive index of a heterogeneous drop is directly related to its nanoparticle concentration, rainbow diffractometry can be used to estimate the concentration of nanoparticles in a drop at any time. This nanoparticle concentration evolves rapidly as the solvent evaporates from the surface of the drop. When all the solvent has evaporated, the nanoparticles agglomerate to form more or less compact grains (crusts, see figure below).
In the case of heterogeneous spherical particles, an original approach is based on homogenization laws that allow for stratification of nanoparticle concentration within the droplets or grains studied. These laws are implemented in theoretical rainbow models to estimate the physical parameters. This stratification is calculated from predictions of the radial profile of the molecular concentration of nanoparticles predicted by a drying model.
Conclusion
In this article, we saw that the optical phenomenon of the rainbow can be used to study the evaporation of a drop of colloidal suspension in acoustic levitation. Yet more proof that light contains a wealth of information for those who know where to look!
With experimental data supplemented by original theoretical models, it is possible to trace the size of the droplet as well as its nanoparticle concentration during drying. These results are extremely useful in a wide range of industries: biotechnology, chemistry, agri-food, etc.
I hope you enjoyed this article, and that it wasn't too tricky to read. The contents of this article are taken from my doctoral thesis. If you'd like to know more, please don't hesitate to contact me or download the manuscript. You can also ask any questions you may have in the comments, and I'll be happy to answer them.
Finally, this technique is still a "laboratory technique", but it is conceivable that it could be used in industry on an automated basis. Perhaps Imasolia will contribute to this technological innovation in the future!